
 University of Michigan
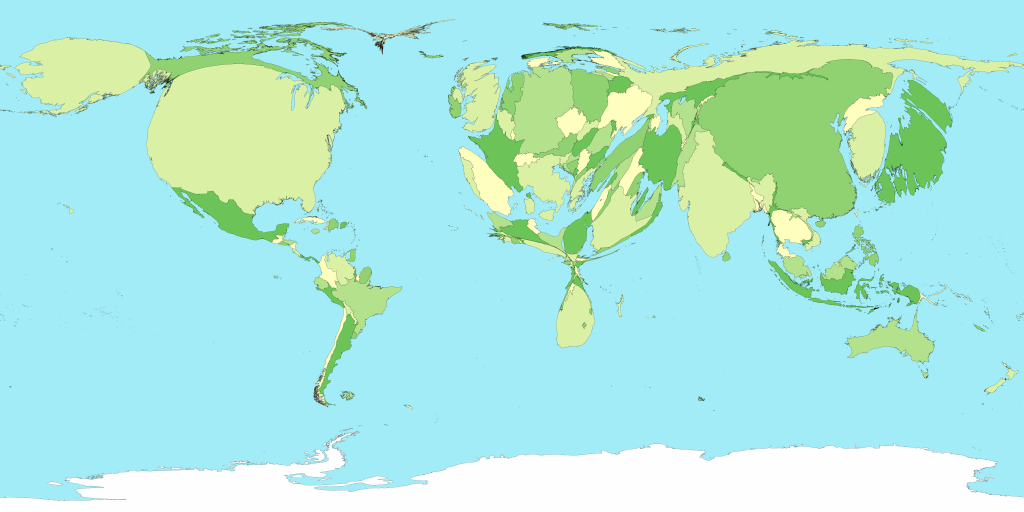
Cartograms are a sort of statistical thematic map. A geographer takes statistical data and then distorts the area of a map to represent the magnitude of the variable. For example, this map is a cartogram displaying information on green-house emissions. The larger the area the more green-emissions. It's easy to identify which regions are doing their part for the environment and which ones are not.
No comments:
Post a Comment