Friday, July 25, 2008

Portolan Chart


The Library of Congress has an extensive collection of historical maps. One type of map is referred to as a Portolan Chart. These maps were used almost exclusively by mariners. They were the most detailed maps of the coast for their time period. Mariners were more interested in the coast line and potential harbors than any information that would be inland. That fact is represented by the lack of any detail and addition of artwork within areas that represent land. Notice the crisscrossing lines that dominate the background of this map. Mariners needed maps with lines that indicated compass directions to make sailing more accurate. 

Infrared Aerial Photograph

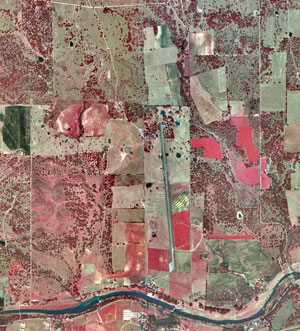
The National Parks website provides a stunning example of an infrared aerial photograph. The benefit to using infrared is the level of detail that can be obtained. This type of film is best used when photographing vegetation. As you can see, this photograph of the Lyndon B. Johnson Ranch shows a wide variety of plants and trees. It is important to remember that the colors seen on an infrared photograph are really "false" colors because the human eye can not see infrared. 

Black and White Aerial Photography


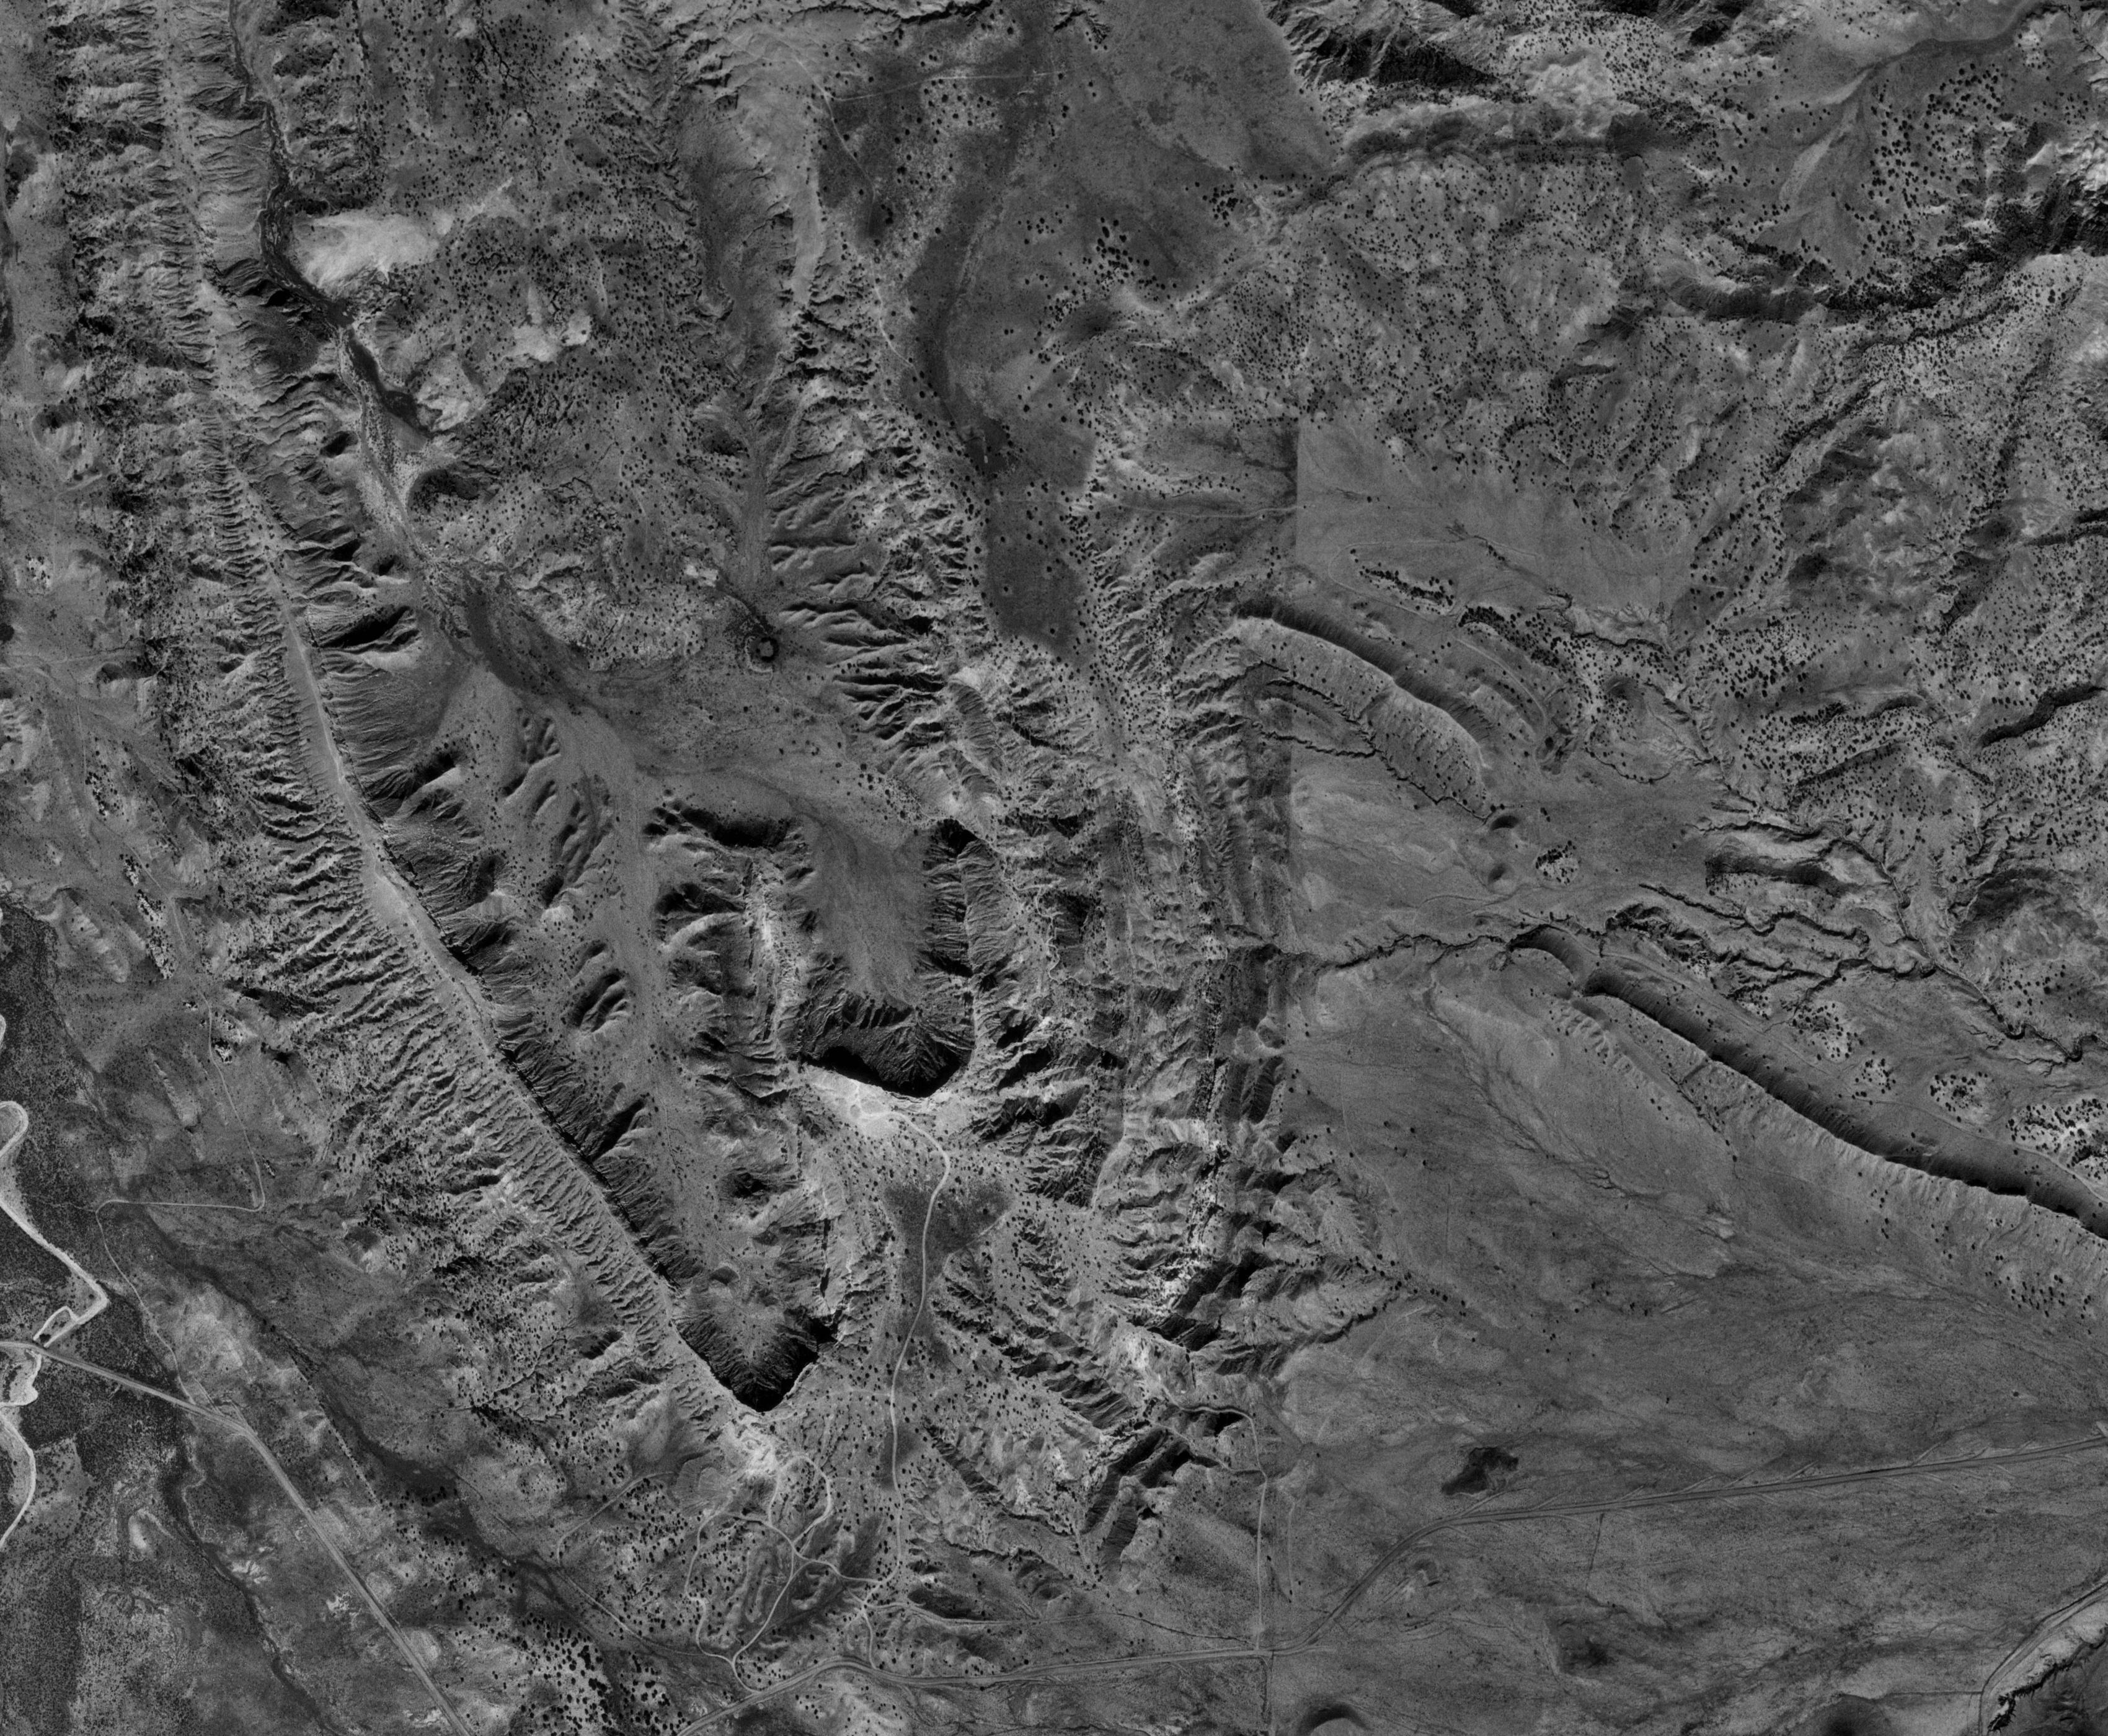
Remote sensing is very useful to mapmakers and geographers. This website from Montana State University shows an example of a black and white aerial photograph taken of San Ysidro, New Mexico. A camera is mounted on an airplane as it flies over an area the camera collects data. The human eye catches on the varying shades of grey and our minds automatically equate darker shades with depth and lighter shades with elevation. Those with the right training can analyze a black and white aerial photograph to determine what objects might be on the ground.  

Dopplar Radar

This image found at The National Weather Forecast Office is a doppler radar image of Tropical Storm Alberto. Weather stations around the country send microwave radiation out into the atmosphere and collect the returning information in order to tell a meteorologist the amount or precipitation, what kind of precipitation, and what direction the weather system is moving among other things. With this doppler radar image of the tropical storm even the untrained observer can see that the heaviest rain is in the center of the storm and that it appears to be moving in a counter clockwise pattern. Doppler Radar is very useful for predicting weather movements and developments. 

Propaganda Maps


Governments are infamous for using propaganda maps in order to influence the ways people think. In this instance, the point is to persuade those who argue they are expansionist, radical, and aggressive that it would be impossible with so many powerful arab nations surrounding them. In fact, I believe this propaganda map also attempts to elicit support by portraying them as the underdog. This map emphasizes a threat to Israel by showing how small and "helpless" it is. More information, along with this map, can be found here. 

Wednesday, July 9, 2008

LIDAR

LIDAR is a type of of remote sensing. Unlike radar and and sonar, LIDAR uses a laser to create images. This particular image is of Kansas City. LIDAR is often used mounted to an airplane. 
This image was provided by Rod Franklin in a newsletter for Imagenotes.com.

Star Plot

Niklas Elmqvist, John Stasko, Philippas Tsigas wrote an article that was published on Palgrave Macmillan . A start plot compares  multiple variables for one observation. This star plot compares variables about homes in Vermont such as the year built, number of rooms, and value. 

Similarity Matrix

I thought this would make things a little bit more fun. Thanks to Yu Shiu at the Electrical Engineering Department at the University of Southern California, this is a similarity matrix of The Beatles' song "Hey Jude." The two variables that are compared are Tempo and PCP. Along the diagonal they are most similar. 

Stem and Leaf Plot

Like the last two graphs posted, a stem and leaf plot is another form of frequency distribution. This is a distribution of adult heights that was taken from a sample. The column on the left is the height in inches and the columns to the right are the height in .1 inches. For example. Out of the entire sample taken there are three individuals who are 68.6 inches because there are three sixes on that row. This graph and more can be found at  the University of Mississippi website. 

Boxplot

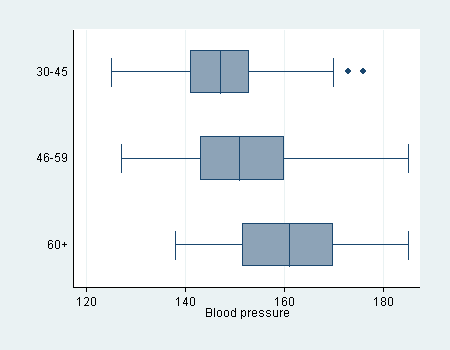
A boxplot is very useful for statistics. A quick look provides the reader with information on the distribution of data. The box contains scores from the 25th-75th percentiles. The 50th percentile is always the line in the middle of the box. The 10th and 90th percentile are illustrated by the lines at the end of the "whiskers." This boxplot can be found at stata.com.

Histogram

A histogram is a method of displaying frequency. The x-axis is the different variable and the y-axis is the frequency. For example, this histogram shows the frequency of numbers that would come up when rolling a pair of dice for the game of backgammon. This histogram comes from the Department of Physics at the University of Toronto.  

Parallel Coordinate Graph

The Ernest Orlando Lawrence Berkeley National Laboratory provides this Parallel Coordinate graph that shows genes and cells. These graphs are useful for comparing multiple sets of data. Each line is a different variable and it is possible to connect a line between the axes. Each line represents a different cell that shows up in different genes (the axis). 

Triangular Plot

A triangular plot is useful for comparing three different variables. In this case, the triangular plot compares voting for the three different parties in the UK. Each color responds to a different winner based on the distribution of votes. This graph was found at ex-parrot.com using data provided by Anthony Wells

Windrose


This is a windrose for Washington state that can be found on the Office of the Washington State Climatologist wesbite. A windrose is an example of a circular plot. Each ring is a percentage and the colors correspond to a wind speed. For this windrose, the wind blew South at a speed of 4-7 Knots about 10% of the time. 

Climograph


A climograph is able to show the relationship between temperature and precipitation by using a line graph and a box plot. In this graph the bar measures the amount of rain and the line measures the temperature for Guam. The NASA website that this graph comes from puts it plainly: the climograph is useful for "making inferences about an area's climate." 

Population Pyramid

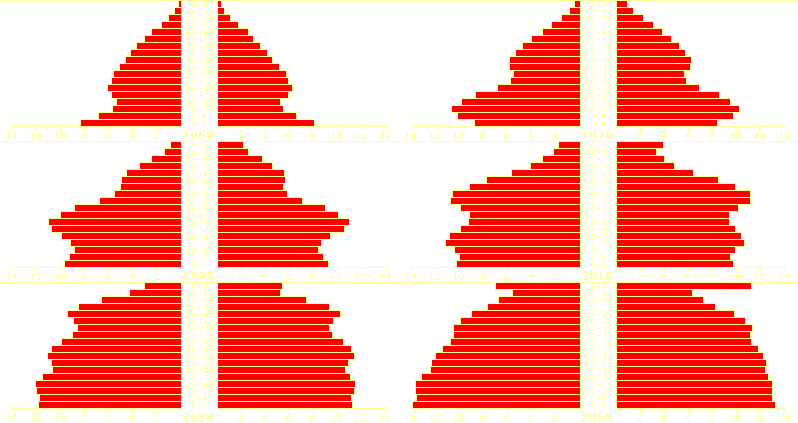
This animated Population pyramid from Flatrock shows both age and gender of the United states population. What makes this graph interesting is the animation that shows the transformation of the population over one hundred years from 1950 to 2050. Obviously this is a prediction based on current trends, but it is possible to see how the effects of advancements in healthcare can contribute to a bloated population. 

Scatterplot

A website called Radicalmath provides this scatterplot distribution to show the relationship between percentage of population and percentage of military recruitment. The direction and clustering of a scatterplot allows the reader to determine a relationship. A tight cluster shows strong relationship while a dispersed cluster indicates no relationship. A cluster pointing up to the right indicates a positive relationship while a cluster pointing down to the right indicates a negative relationship. This scatterplot shows a positive relationship between the percentage of population and the percent of military recruitment. 

Index Value Plot

On the USGS website you can find this index plot graph of stream flow between 1999 and 2006. An index value plot does not use absolute numbers. Instead, an average is taken and the start point begins at that number. It is now possible to determine from this graph when the stream flow was below or above "normal." All plotted values are relative to the index value. 

Lorenz Curve

The Lorenz Curve is most often used in economics. It can explain the distribution of income among a population like this graph, but it can also be used for other variables. This chart is very informative. The straight line in a Lorenz curve shows what equal distribution would be. The curved lines connect dots showing the actual distribution. Thanks to the breakdown provided, it is easy to understand how this Lorenz curve shows the top 25% of the population has 70% of the wealth while the bottom 25% has only 5% of the wealth. This graph can be found at Answers.com

Bilateral Chart

This is a bilateral graph of humanitarian aid around the world. A bilateral graph is useful for visualizing the effects or relationships between two related variables. In this instance the bar graph is the change of humanitarian aid in US dollars. The line graph is the percentage of change in humanitarian aid. It makes it very easy to see that despite a significant decrease in money going to humanitarian aid in the US the percentage of change is very minimal. This stands in contrast to Luxembourg where their increase in in monetary aid was very small, but the percentage of increase was very significant. This bilateral graph can be found out the Global Humanitarian Assistance website.