
 A boxplot is very useful for statistics. A quick look provides the reader with information on the distribution of data. The box contains scores from the 25th-75th percentiles. The 50th percentile is always the line in the middle of the box. The 10th and 90th percentile are illustrated by the lines at the end of the "whiskers." This boxplot can be found at stata.com.
Wednesday, July 9, 2008
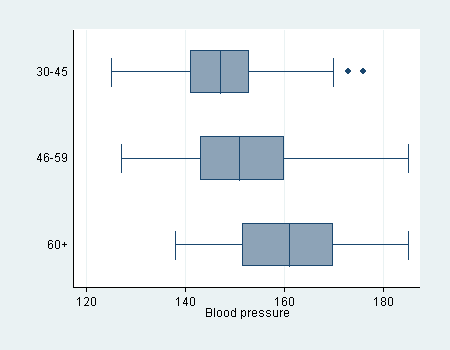
Boxplot
A boxplot is very useful for statistics. A quick look provides the reader with information on the distribution of data. The box contains scores from the 25th-75th percentiles. The 50th percentile is always the line in the middle of the box. The 10th and 90th percentile are illustrated by the lines at the end of the "whiskers." This boxplot can be found at stata.com.
Subscribe to:
Post Comments (Atom)
No comments:
Post a Comment